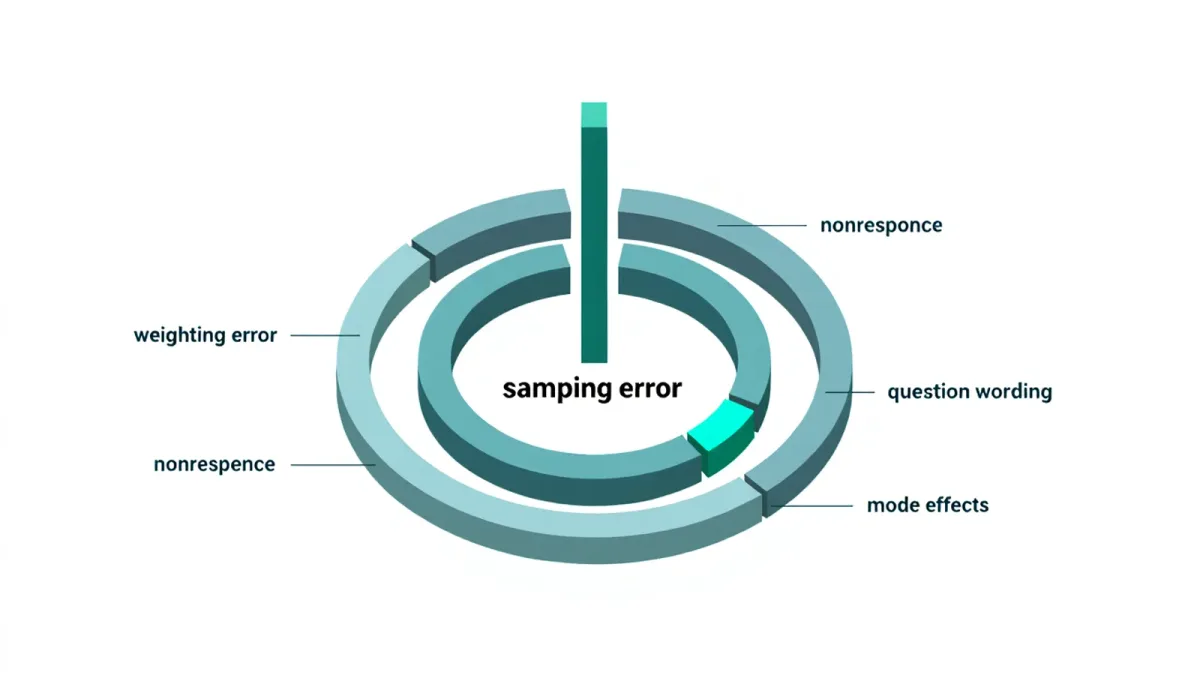
The topline is the least reliable number on the page. Sensible reading starts with the margin of error, checks whether a lead is bigger than roughly twice that figure, and treats dramatic one-off results with patience. Who was asked, and how the sample was weighted, tells more than the horse race.
The arithmetic is settled. A margin of error of plus or minus 3 percentage points at the 95 percent confidence level means that, out of 100 identical surveys, about 95 results would land within 3 points of the true population value, per a Pew Research Center methods explainer. The American Association for Public Opinion Research calls the measure the price of not talking to everyone in the target population. This connects to our earlier piece, Fact Checking Guide — The Anatomy of a Viral Claim: Tracing Facts to Sources.
What Does the Margin of Error Actually Measure?
It measures how close a sample result should sit to the truth. A margin of plus or minus 3 points means the value for the full population most likely lies within 3 points of the reported number. The statistic expresses the amount of random sampling error in a survey, per the reference entry on the measure. It does not cover bad questions or lopsided samples.
Sampling is only one source of error, and the published margin assumes probability sampling in the first place. A survey of volunteers who opt in carries extra uncertainty that the classic formula understates. The label tells a reader which kind of poll sits on the page. Readers following this should also see Twenty-Four Languages, One Law: What Multilingual Parliaments Actually Cost.
When Is a Lead Not Really a Lead?
When it is smaller than about twice the margin of error. Pew's explainer gives the case of a 5-point lead with a 3-point margin for each candidate. The margin for the difference between the two runs roughly 6 points, so the observed lead could still be sampling noise. Only a gap of 6 points or more clears the bar.
The same warning applies to movement between surveys. Pew calculates a margin of plus or minus 8 points for a 3-point shift between two such polls. A surge of that size is consistent with no change at all. Patience is the correct response to a dramatic swing.
Why Do Weighting and Sample Design Widen the Margin?
Because polls overhear some people more than others. Without adjustment, surveys tend to overrepresent people who are easy to reach and underrepresent those who are hard to interview, the Pew explainer notes, so pollsters weight the data to match the population on demographic measures.
The fix carries a cost. Weighting raises variability, an effect statisticians call the design effect, and a margin that ignores it claims more precision than the data warrant. Members of the American Association for Public Opinion Research's Transparency Initiative are required to disclose how their weighting was performed, Pew among them. That disclosure is worth checking before a number gets quoted.
How Should a Reader Treat Subgroups and Outliers?
With more caution than the headline offers. When subgroup results are reported, the sampling error margin for those figures is larger than the margin for the sample as a whole, AAPOR's polling resources note. A claim about one slice of the electorate needs its own error range, not the topline's.
Outliers deserve the same pause. Pew examined 590 national polls listed during the 2012 campaign and expected about 30 of them to miss the true value by more than their margins, purely by chance. Those are the surveys that draw the loudest attention. Replication in later polls, not drama, is what confirms a shift.
Conclusion: Slow Numbers Beat Loud Numbers
A poll is an estimate with a stated range, and the range is the story. Read the margin before the topline. Double it before believing a lead. Treat a lone outlier as a curiosity until other surveys agree.
The habit comes down to two questions: who answered, and what was done to make the sample match the public. Anyone who wants to know how to analyze poll data starts there. Ask both, and most polls stop fooling anyone. The statistic itself is larger than any one survey. The margin of error defines how much random sampling error sits in a result, and the larger it is, the less confidence a reader should have that the poll mirrors a full census of everyone.